
- 목차 -
1. ResourceQuota
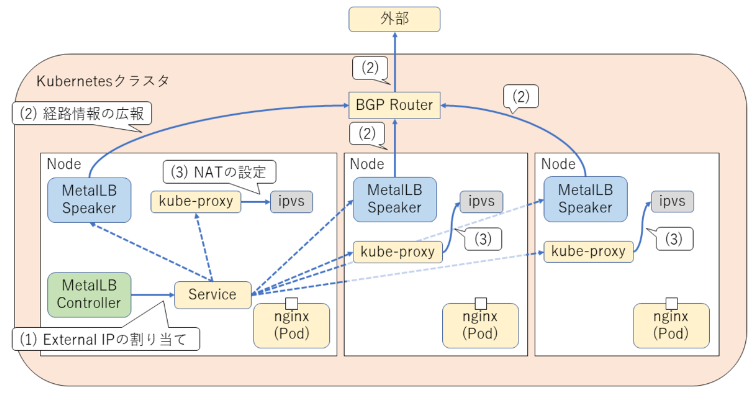
metallb 아키텍처
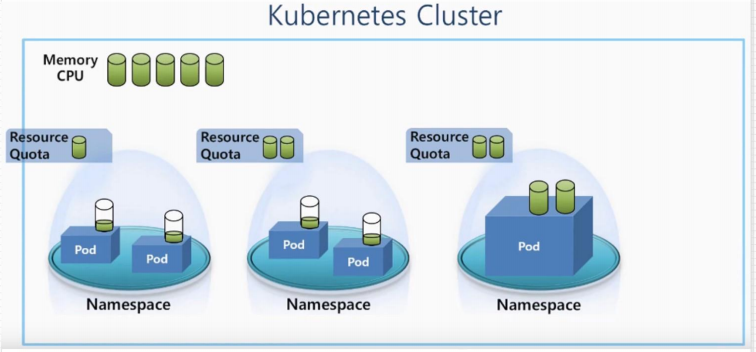
resourcequotas : 자원의 한도를 정하는 것
한도가 지나치면 pod가 만들어지지 않는다
ResourceQuota
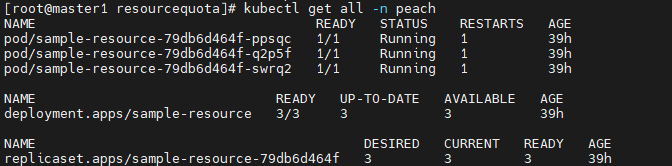
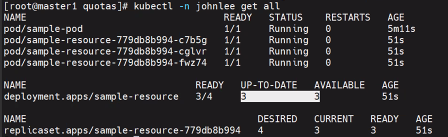
# kubectl get all -n peach # 현재 peach 네임스페이스에 존재하는 자원
자원 정리하기
# kubectl delete resourcequotas sample-resourcequota
# kubectl delete ns peach # 네임스페이스 지우기
# kubectl create ns peach
# mkdir quotas && cd $_
/*
# vi sample-resourcequota.yaml
apiVersion: v1
kind: ResourceQuota
metadata:
name: sample-resourcequota
namespace: peach
spec:
hard:
count/pods: 5
kubectl describe resourcequotas sample-resourcequota
kubectl run pod new-nginx --image=nginx
*/
# vi sample-resourcequota-usable.yaml
apiVersion: v1
kind: ResourceQuota
metadata:
name: sample-resourcequota-usable
namespace: peach
spec: # pod 1개당 스펙
hard:
requests.cpu: 1 # requests는 요청 사용량. 1core를 뜻함. '1000m'와 같음
requests.memory: 1Gi
requests.ephemeral-storage: 5Gi # 임시라는 뜻으로 pod에 적용되는 storage
requests.nvidia.com/gpu: 2
limits.cpu: 4 # pod의 최대 사용량
limits.memory: 2Gi
limits.ephemeral-storage: 10Gi
limits.nvidia.com/gpu: 4
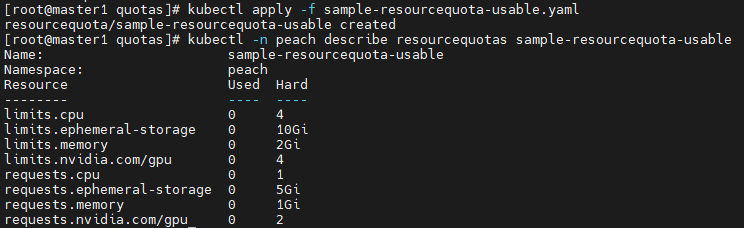
# kubectl apply -f sample-resourcequota-usable.yaml
# kubectl -n peach describe resourcequotas sample-resourcequota-usable
2. LimitRange
# vi sample-resource.yaml
apiVersion: apps/v1
kind: Deployment
metadata:
name: sample-resource
namespace: peach
spec:
replicas: 4
selector:
matchLabels:
app: sample-app
template:
metadata:
labels:
app: sample-app
spec:
containers:
- name: nginx-container
image: 192.168.1.157:5000/nginx:latest
resources:
requests: # 요구 사항
memory: "250Mi"
cpu: "250m"
limits: # 최대
memory: "500Mi"
cpu: "1000m"
# kubectl apply -f sample-resource.yaml
# vi sample-pod.yaml
apiVersion: v1
kind: Pod
metadata:
name: sample-pod
namespace: peach
spec:
containers:
- name: nginx-container
image: 192.168.1.157:5000/nginx:latest
# k apply -f sample-pod.yaml # 리소스 세팅을 하지 않으면 pod가 만들어지지 않는다

LimitRange
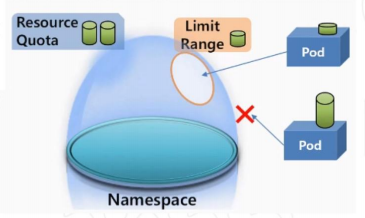
- 한도 설정
- 리소스 세팅을 하지 않아도 pod를 생성할 수 있음
# vi sample-limitrange-container.yaml
apiVersion: v1
kind: LimitRange
metadata:
name: sample-limitrange-container
namespace: peach
spec:
limits:
- type: Container
default: # pod생성시 리소스 세팅을 안했을 때 적용. 하나의 컨테이너가 쓸 수 있는 최대값
memory: 500Mi
cpu: 1000m
defaultRequest: # 하나의 컨테이너가 쓸 수 있는 최소값
memory: 250Mi
cpu: 250m
max: # pod생성시 리소스 세팅을 했을 때 적용.
memory: 500Mi
cpu: 1000m
min:
memory: 250Mi
cpu: 250m
maxLimitRequestRatio: # request/limt 요청 비율. 1기가를 요청하면 최대가 2로 잡히게 된다
memory: 2
cpu: 4
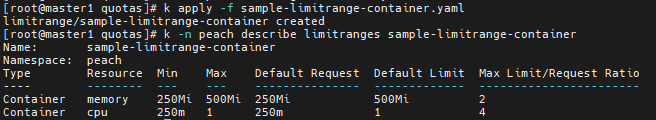
# k apply -f sample-limitrange-container.yaml
# k -n peach describe limitranges sample-limitrange-container
# vi sample-pod.yaml
apiVersion: v1
kind: Pod
metadata:
name: sample-pod
namespace: peach
spec:
containers:
- name: nginx-container
image: 192.168.1.157:5000/nginx:latest
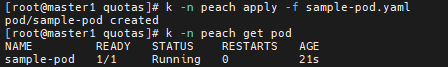
# k -n peach apply -f sample-pod.yaml # 리소스 세팅을 하지 않았지만 생성되었다
# k -n peach get pod
# k -n peach describe pod sample-pod # 한도가 정해졌다
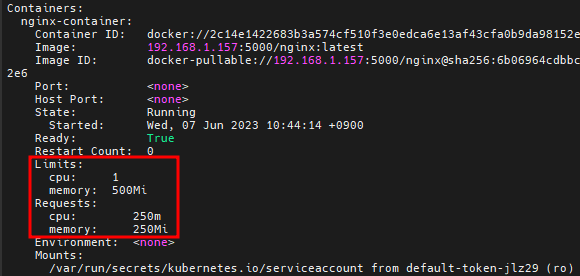
한도로 인해서 pod를 4개까지 만들 수 있고 5개는 만들 수 없을 것이다
# cp sample-resource.yaml test-resource.yaml
# vi test-resource.yaml # 한도를 지정하지 않고 만들어보기
apiVersion: apps/v1
kind: Deployment
metadata:
name: sample-resource
namespace: peach
spec:
replicas: 4
selector:
matchLabels:
app: sample-app
template:
metadata:
labels:
app: sample-app
spec:
containers:
- name: nginx-container
image: 192.168.1.157:5000/nginx:latest
# resources:
# requests: # 요구 사항
# memory: "250Mi"
# cpu: "250m"
# limits: # 최대
# memory: "500Mi"
# cpu: "1000m"
# k apply -f test-resource.yaml
# k -n peach get pod
/* # vi sample-pod-overrequest.yaml
apiVersion: v1
kind: Pod
metadata:
name: sample-pod-overrequest
spec:
containers:
- name: nginx-container
image: nginx:1.16
resources:
requests:
cpu: 100m
limits:
cpu: 100m
# vi sample-pod-overratio.yaml
apiVersion: v1
kind: Pod
metadata:
name: sample-pod-overratio
spec:
containers:
- name: nginx-container
image: nginx:1.16
resources:
requests:
cpu: 125m
limits:
cpu: 500m
*/

# k delete -f . # 현재 폴더에 있는 yaml파일을 가져와서 다 지움
# k delete ns test-namespace
# k delete ns peach
# kubectl config get-contexts
# kubectl config set-context kubernetes-admin@kubernetes --namespace default
3. 파드 스케줄
파드 스케줄(자동 배치)
# mkdir schedule && cd $_
# vi pod-schedule.yaml
apiVersion: v1
kind: Pod
metadata:
name: pod-schedule-metadata
labels:
app: pod-schedule-labels
spec:
containers:
- name: pod-schedule-containers
image: 192.168.1.157:5000/nginx:latest
ports:
- containerPort: 80
---
apiVersion: v1
kind: Service
metadata:
name: pod-schedule-service
spec:
type: NodePort
selector:
app: pod-schedule-labels
ports:
- protocol: TCP
port: 80
targetPort: 80
# cp pod-schedule pod-schedule2
# k apply -f pod-schedule.yaml
# k apply -f pod-schedule2.yaml
# k get pod -o wide # 자동적으로 pod를 worker1 worker2 노드에 배치한다

4. 파드 스케줄(수동 배치)
특정 worker노드에 pod 생성하기
# vi pod-nodename.yaml
apiVersion: v1
kind: Pod
metadata:
name: pod-nodename-metadata
labels:
app: pod-nodename-labels
spec:
containers:
- name: pod-nodename-containers
image: nginx
ports:
- containerPort: 80
nodeName: worker2 # worker2 노드에 pod 수동 생성
---
apiVersion: v1
kind: Service
metadata:
name: pod-nodename-service
spec:
type: NodePort
selector:
app: pod-nodename-labels
ports:
- protocol: TCP
port: 80
targetPort: 80
# k apply -f pod-nodename.yaml
# k get pod -o wide # worker2 노드에 생성되었다

# k get pod --selector=app=pod-nodename-labels -o wide --show-labels # 라벨을 지정해서 pod 조회하기
# k get no --show-labels # 노드도 LABELS가 있다

@@ 노드 셀렉터(수동 배치)
# kubectl label nodes worker1 tier=dev # worker1 노드에게 LABELS 지정하기

# kubectl get nodes --show-labels

# vi pod-nodeselector.yaml
apiVersion: v1
kind: Pod
metadata:
name: pod-nodeselector-metadata
labels:
app: pod-nodeselector-labels
spec:
containers:
- name: pod-nodeselector-containers
image: 192.168.1.157:5000/nginx:latest
ports:
- containerPort: 80
nodeSelector:
tier: dev # worker1의 LABELS
---
apiVersion: v1
kind: Service
metadata:
name: pod-nodeselector-service
spec:
type: NodePort
selector:
app: pod-nodeselector-labels
ports:
- protocol: TCP
port: 80
targetPort: 80
# k apply -f pod-nodeselector.yaml
# k get pod -o wide # worker1에 생성되었다

# kubectl label nodes worker1 tier- # 노드에 설정한 LABELS 지우기
# kubectl get nodes --show-labels
5. taint, toleration
taint와 toleration
taint 감염
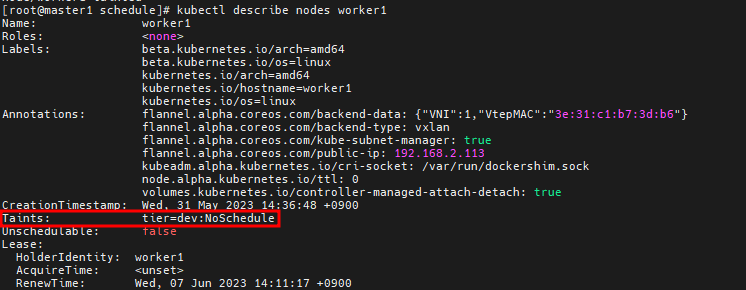
# kubectl taint node worker1 tier=dev:NoSchedule # worker1에 pod가 생기지 않는다

# k get po -o wide # 현재 worker1 worker2에 각각 2개의 pod가 있다

# kubectl describe nodes worker1
# vi pod-taint.yaml
apiVersion: v1
kind: Pod
metadata:
name: pod-taint-metadata
labels:
app: pod-taint-labels
spec:
containers:
- name: pod-taint-containers
image: 192.168.1.157:5000/nginx:latest
ports:
- containerPort: 80
tolerations: # taint로 된 worker 무시하고 pod를 생성하는 명령
- key: "tier"
operator: "Equal"
value: "dev"
effect: "NoSchedule"
---
apiVersion: v1
kind: Service
metadata:
name: pod-taint-service
spec:
type: NodePort
selector:
app: pod-taint-labels
ports:
- protocol: TCP
port: 80
targetPort: 80
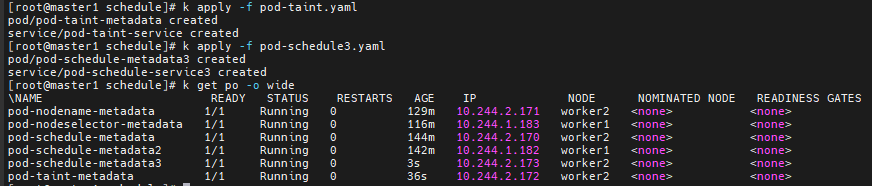
# k apply -f pod-taint.yaml
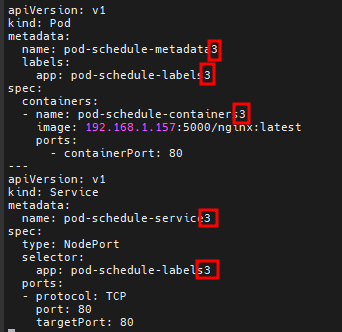
# cp pod-schedule.yaml pod-schedule3.yaml
# vi pod-schedule3.yaml
# k apply -f pod-schedule3.yaml
# k get po -o wide
# k taint node worker1 tier=dev:NoSchedule- # taint 해제
6. 프로메테우스 설치
Prometheus
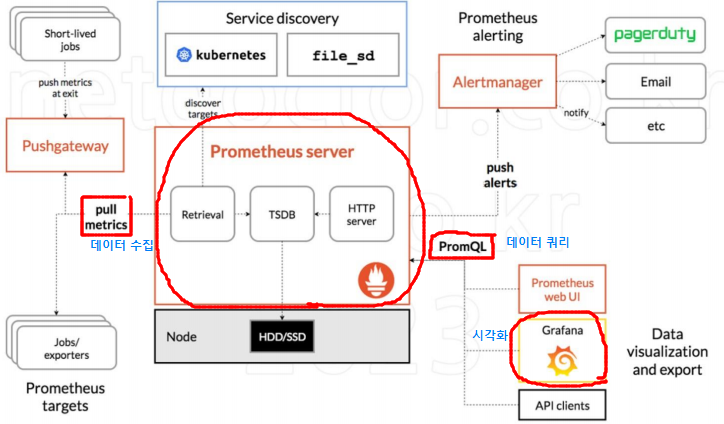
- 프로메테우스 서버가 worker node에서 pod로 존재한다
- PromQL은 프로메테우스내의 쿼리 언어를 통해서 Grafana가 프로메테우스가 수집해놓은 데이터를 시각화한다
- Prometheus는 CNCF가호스트하는 오픈 소스 소프트웨어 모니터링 도구이다
- 운영 비용이나 서버 측 머신 리소스가 필요하다다.
- 여러 가지 메트릭을 수집/그래프화/모니터링할 수 있다.
- 대부분의 모니터링 도구가 Push 방식 즉, 대상 서버에 에이전트를 설치하고 이 에이전트가 메트릭 데이터를 수집해서 모니터링 서버로 보내면 상태를 보여주는 방식을 취한다.
- 하지만 Prometheus는 Pull 방식을 사용하여, 대상 서버에 에이전트가 떠있으면 Promethe니s 서버가 주기적으로 에이전트에 접속해서 데이터를 가져오는 방식을 취한다.
Grafana
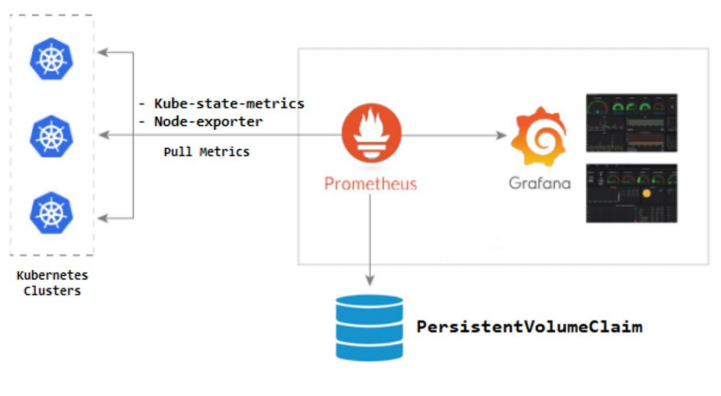
- 쿠버네티스 worker node에 Kube-state-metrics와 Node-exporter 에이전트를 설치해야한다
- Grafana는 오픈소스 메트릭 데이터 시각화 도구로 메트릭 분석 플랫폼을 지향하고 있다.
- Torkel Odegaard의 주도로 2014년 처음 릴리스되었으며, 처음에는 이트 Graphite, InfluxDB, OpenTSDB 등을 지원하는 오픈소스 대시보드 도구로 개발되었다.
- 메트릭 정보를 시각화하고 대시보드를 구성한다는 큰 틀은 여전히 변함이 없다
- 하지만 , AWS CloudWatch, Azure Monitor와 같은 클라우드 데이터 소스를 비롯해 로키Loki나 ElasticSearch 등을 기반으로 로그 데이터를 지원하는 등 더 많은 데이터 소스를 지원하고 있다.
prometheus 설치
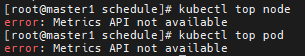
# kubectl top node # 에러가 난다. Metrics API가 설치되지 않았기 때문
# kubectl top pod
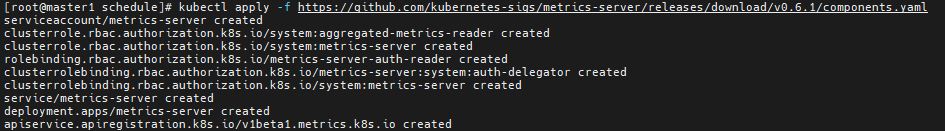
--- metric-server
# kubectl apply -f https://github.com/kubernetes-sigs/metrics-server/releases/download/v0.6.1/components.yaml # Metrics 서버(pod) 설치. 이제 top 명령이 가능해지게 된다
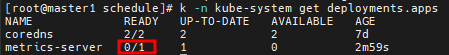
# k -n kube-system get deployment # 아직 running이 아니다. 명령어 하나가 빠져있기 때문
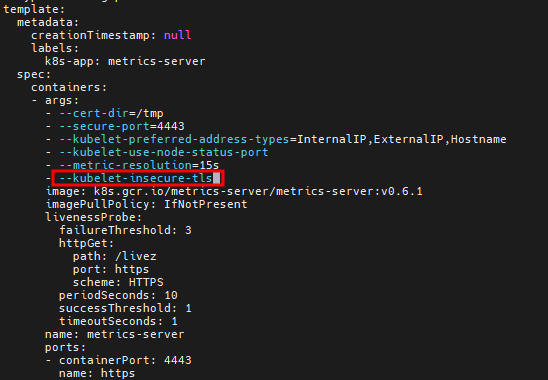
# kubectl edit deployments.apps -n kube-system metrics-server
--kubelet-insecure-tls # 컨테이너 args 부분에 추가하기
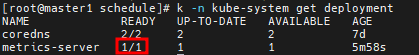
# k -n kube-system get deployment
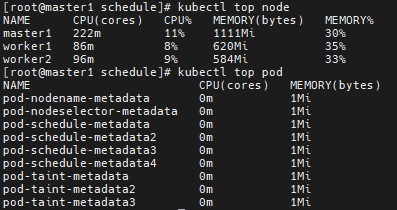
# kubectl top node # CPU, Memory 사용률을 15초 간격으로 보여준다
# kubectl top pod
프로메테우스 설치
# kubectl create ns monitoring
# yum install git -y
# git clone https://github.com/hali-linux/my-prometheus-grafana.git
# cd my-prometheus-grafana
# kubectl apply -f prometheus-cluster-role.yaml # 프로메테우스 권한
# kubectl apply -f prometheus-config-map.yaml # 프로메테우스 설정
# kubectl apply -f prometheus-deployment.yaml # 프로메테우스 서버
# kubectl apply -f prometheus-node-exporter.yaml # 워커노드에 설치되는 프로메테우스 에이전트
# kubectl apply -f prometheus-svc.yaml # 서버 접속 서비스
# kubectl get pod -n monitoring
# kubectl get pod -n monitoring -o wide

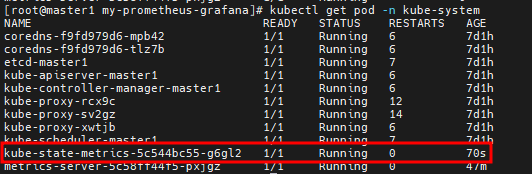
# kubectl apply -f kube-state-cluster-role.yaml # 프로메테우스 파드가 마스터노드에 설치되기 위한 작업들
# kubectl apply -f kube-state-deployment.yaml
# kubectl apply -f kube-state-svcaccount.yaml
# kubectl apply -f kube-state-svc.yaml
# kubectl get pod -n kube-system
7. 그라파나 설치, 프로메테우스/그라파나 접속
그라파나 설치
-- 도커허브 한도 초과로 이미지 사설리포지토리에 올린 후 가져와야함
# docker login
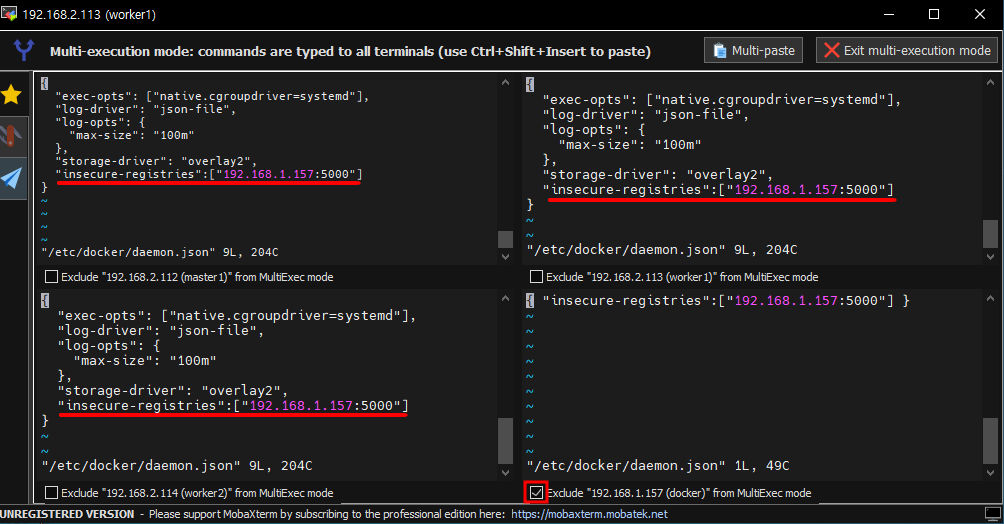
# vi /etc/docker/daemon.json # 접속 권한 확인하기

# systemctl restart docker
# docker pull grafana/grafana:latest
# docker tag grafana/grafana:latest 192.168.1.157:5000/grafana:latest
# docker push 192.168.1.157:5000/grafana:latest
# vi grafana.yaml # 이미지 변경하기
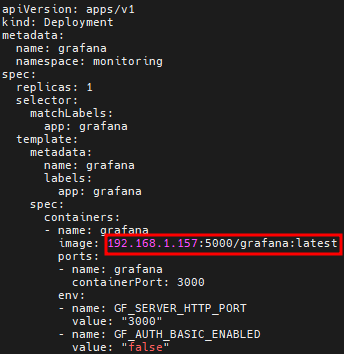
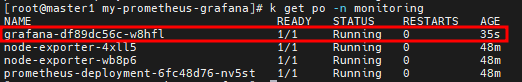
# kubectl apply -f grafana.yaml
# kubectl get pod -n monitoring
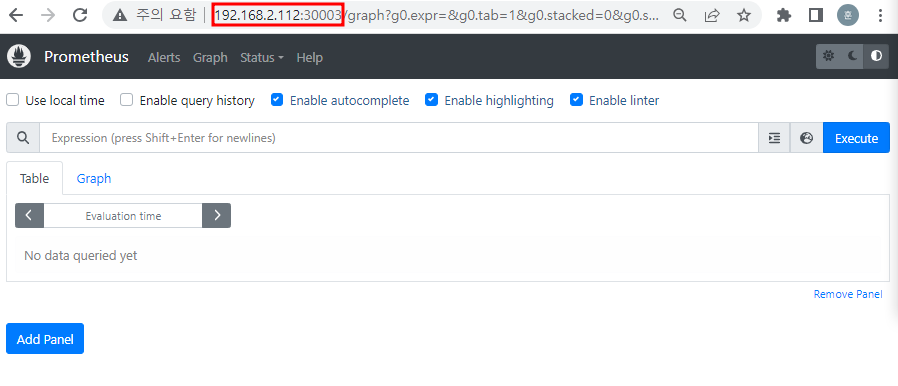
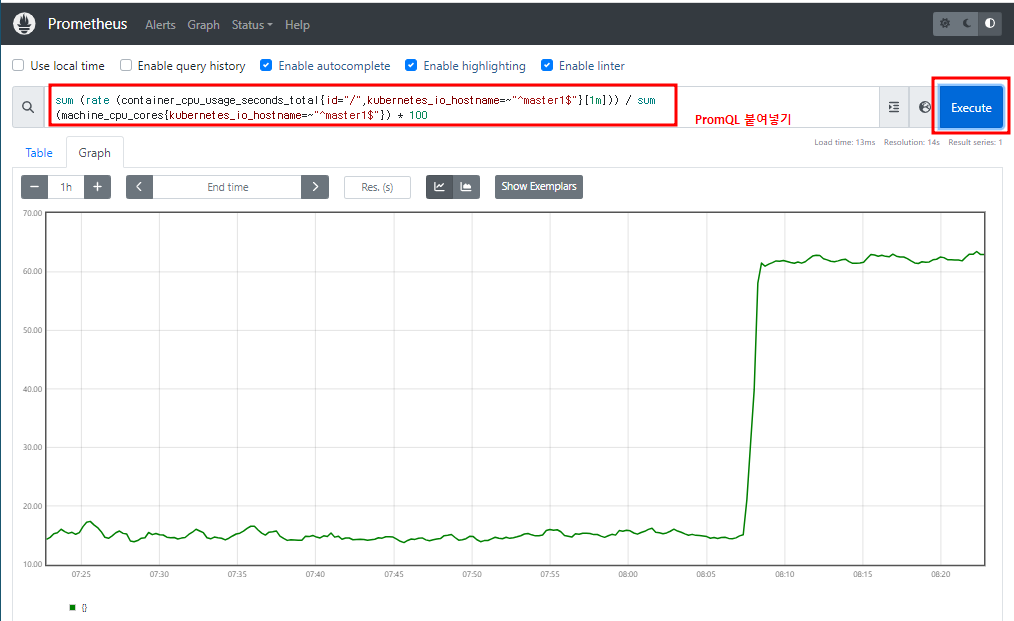
프로메테우스 접속
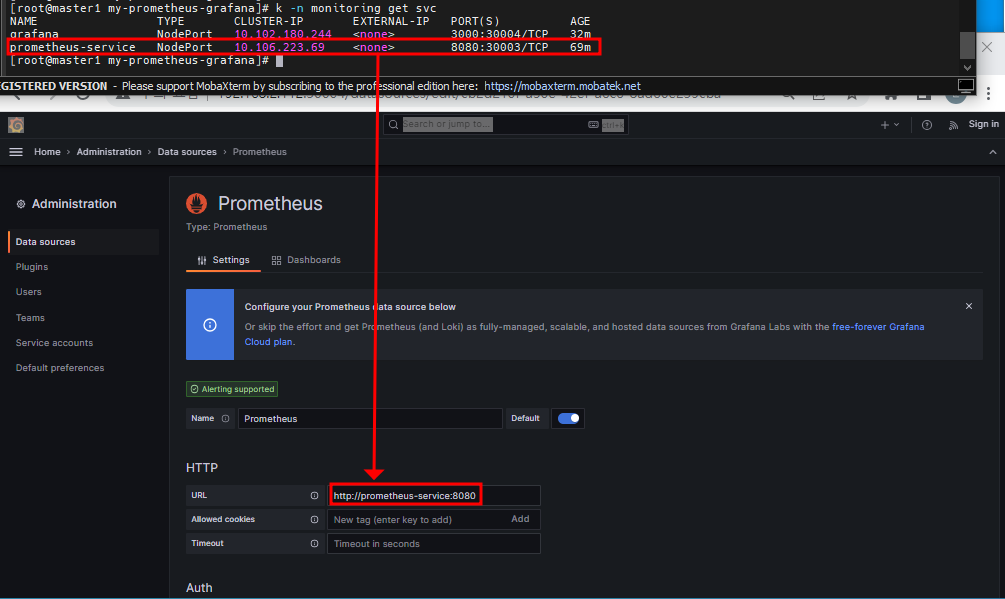
# k get svc -n monitoring

URL창에 192.168.2.112:30003 입력하면 프로메테우스 페이지가 뜬다
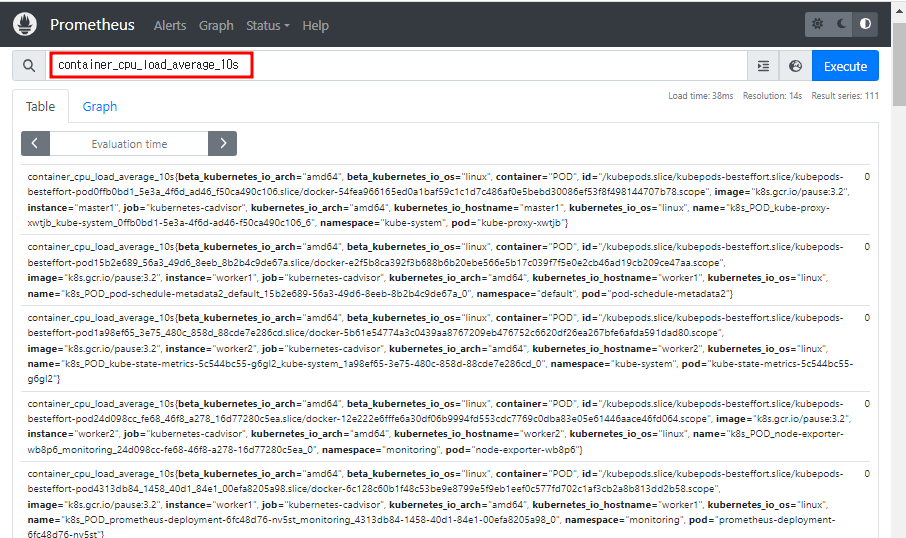
container_cpu_load_average_10s # 떠있는 pod들의 CPU 평균 사용률
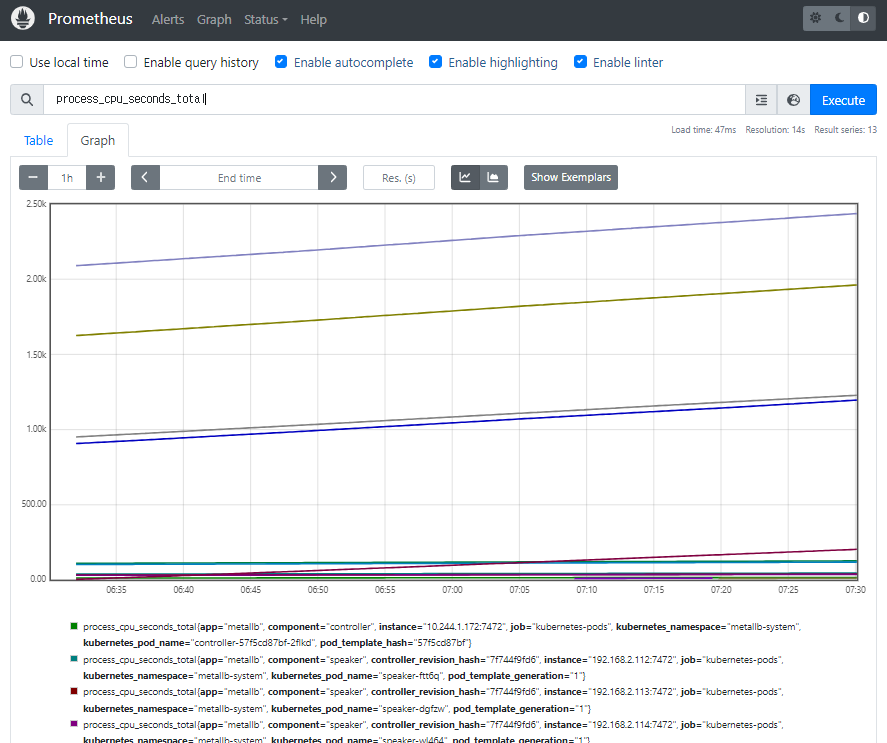
process_cpu_seconds_total
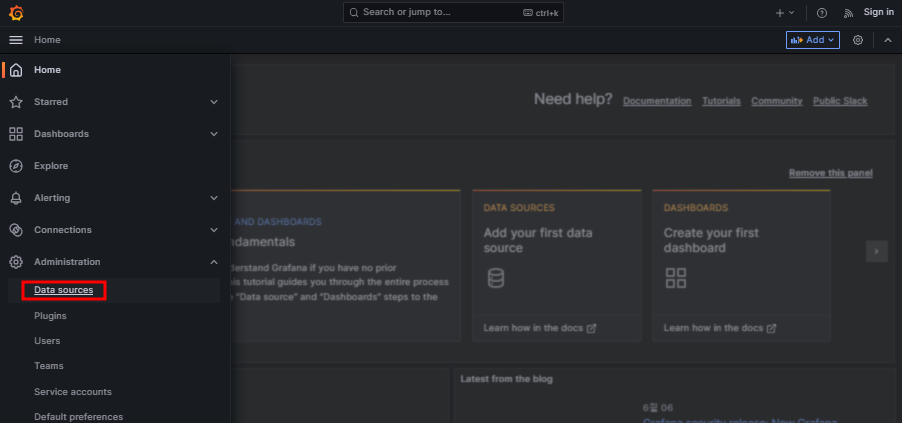
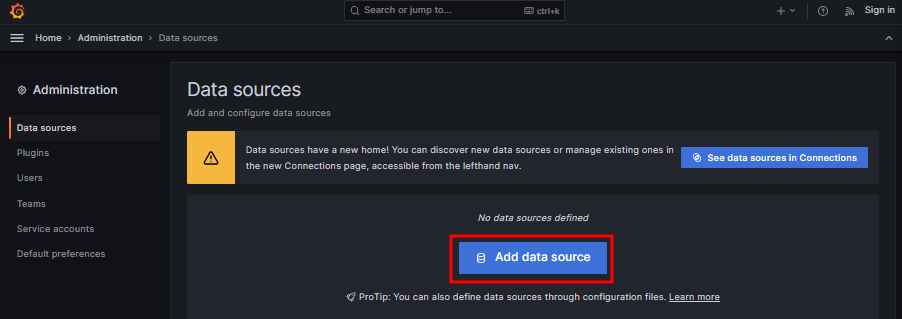
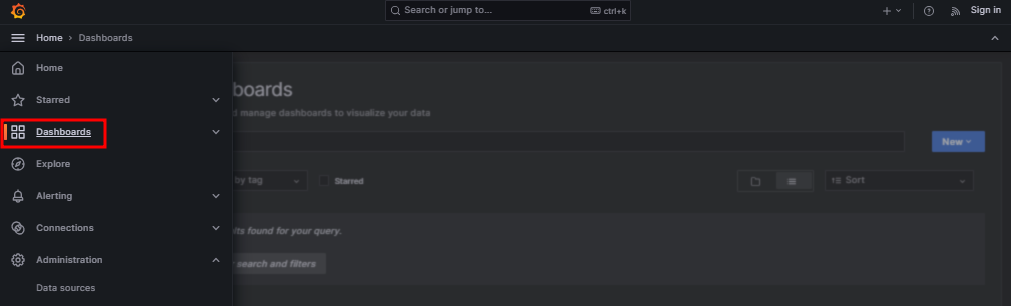
그라파나 접속
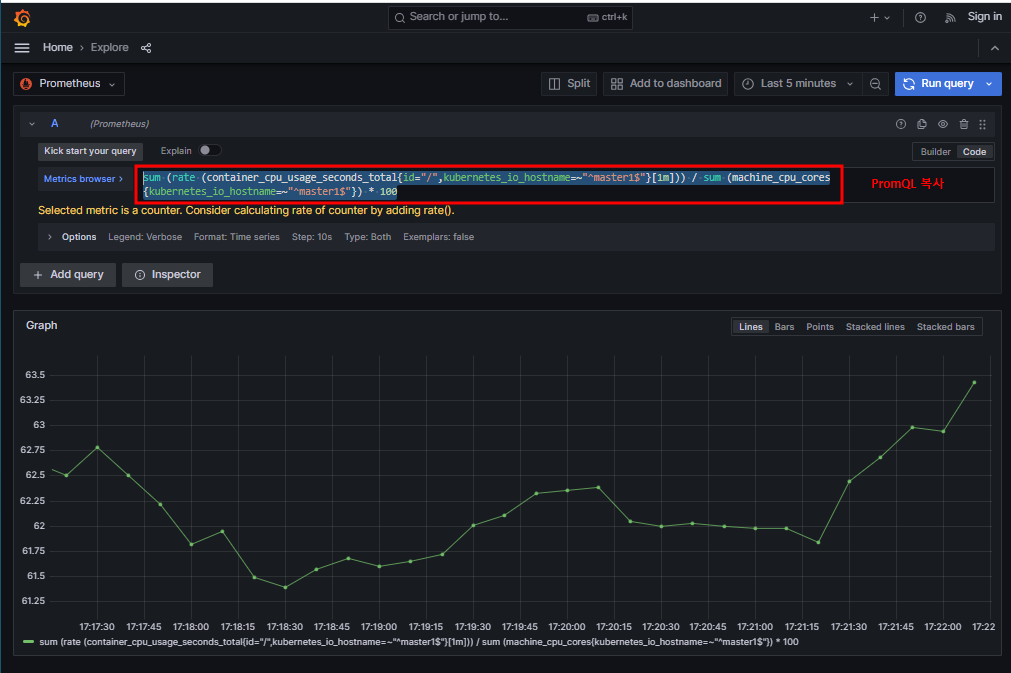
Grafana가 PromQL을 통해서 시각화를 해준다
URL창에 192.168.2.112:30004 입력하면 그라파나 페이지가 뜬다
데이터 소스 선택
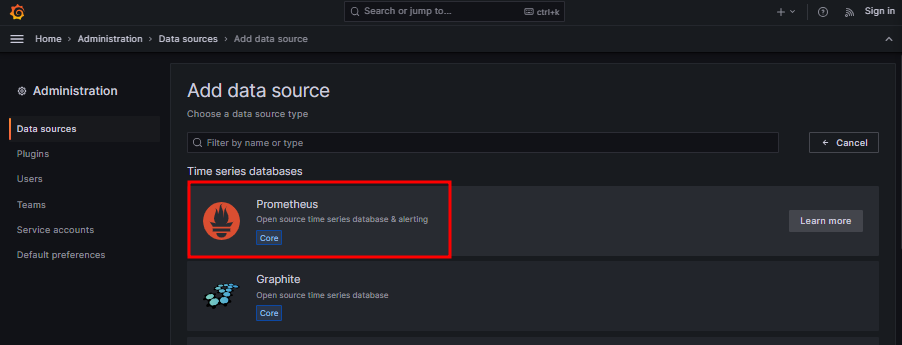
프로메테우스에 접속하기 위해 정보 입력
http://prometheus-service:8080 입력
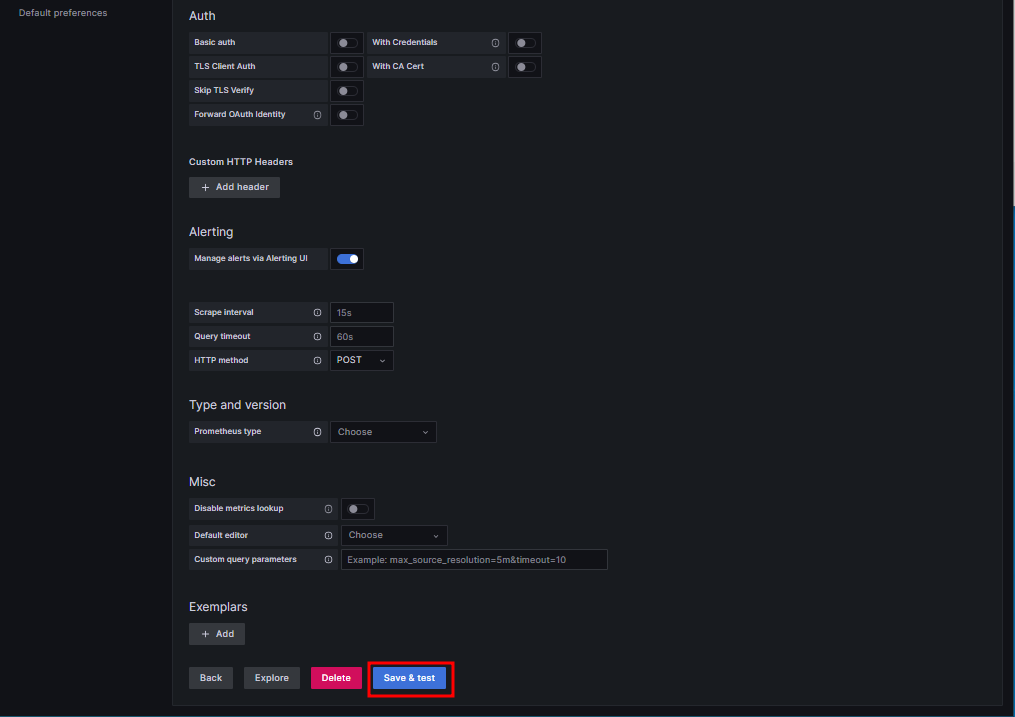
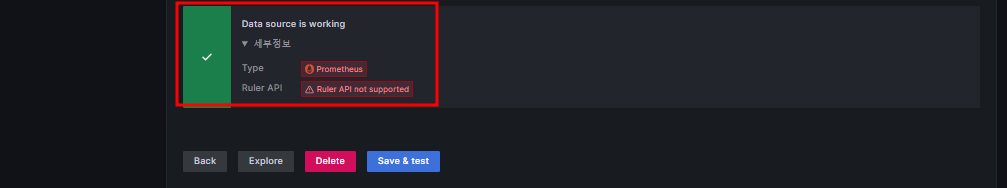
데이터를 가져올 준비를 끝났다
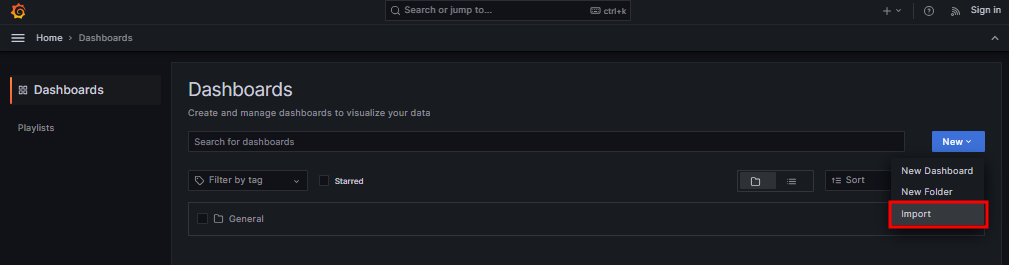
315 Load
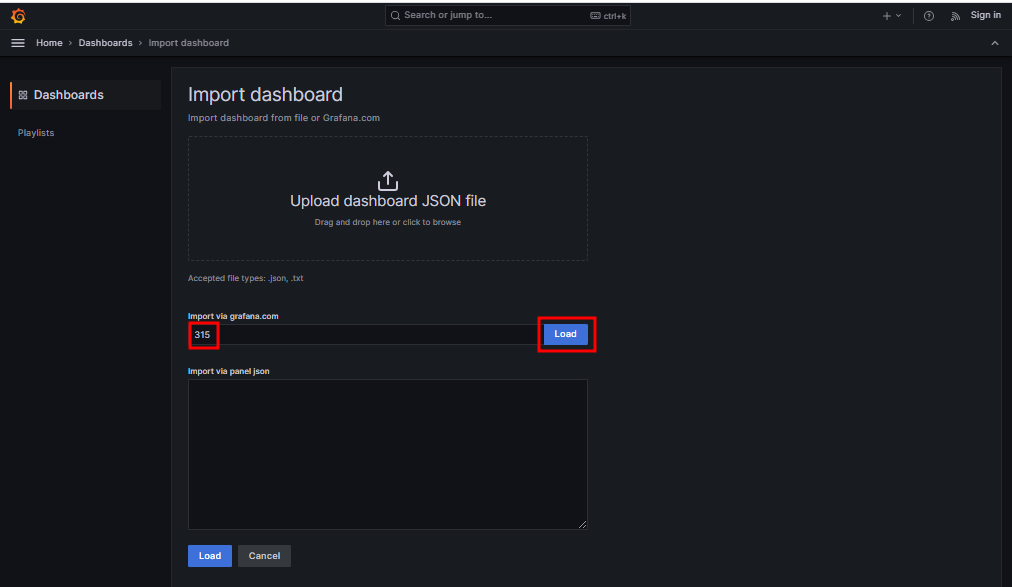
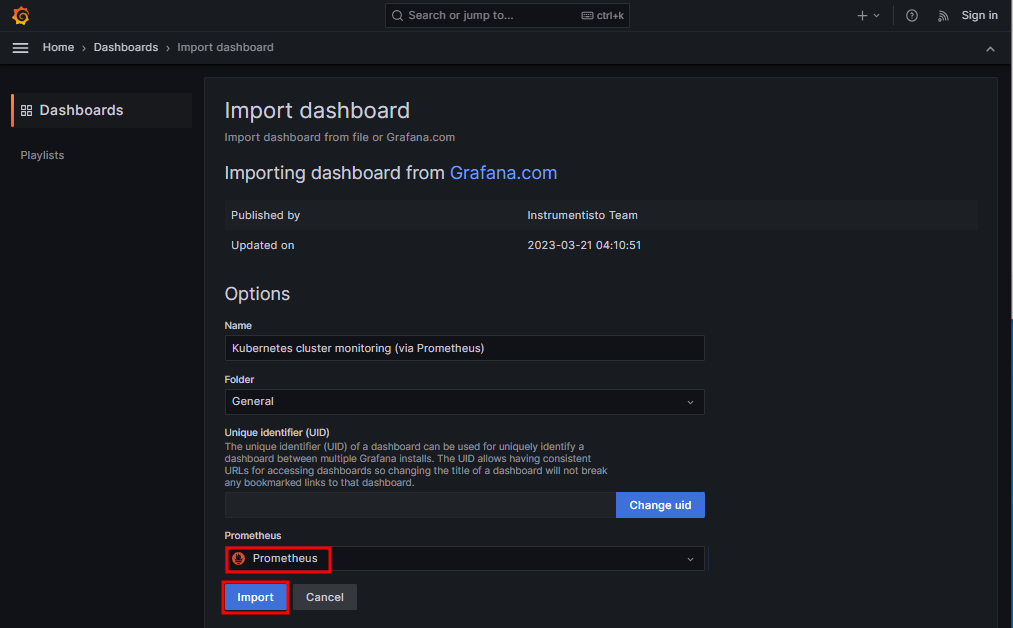
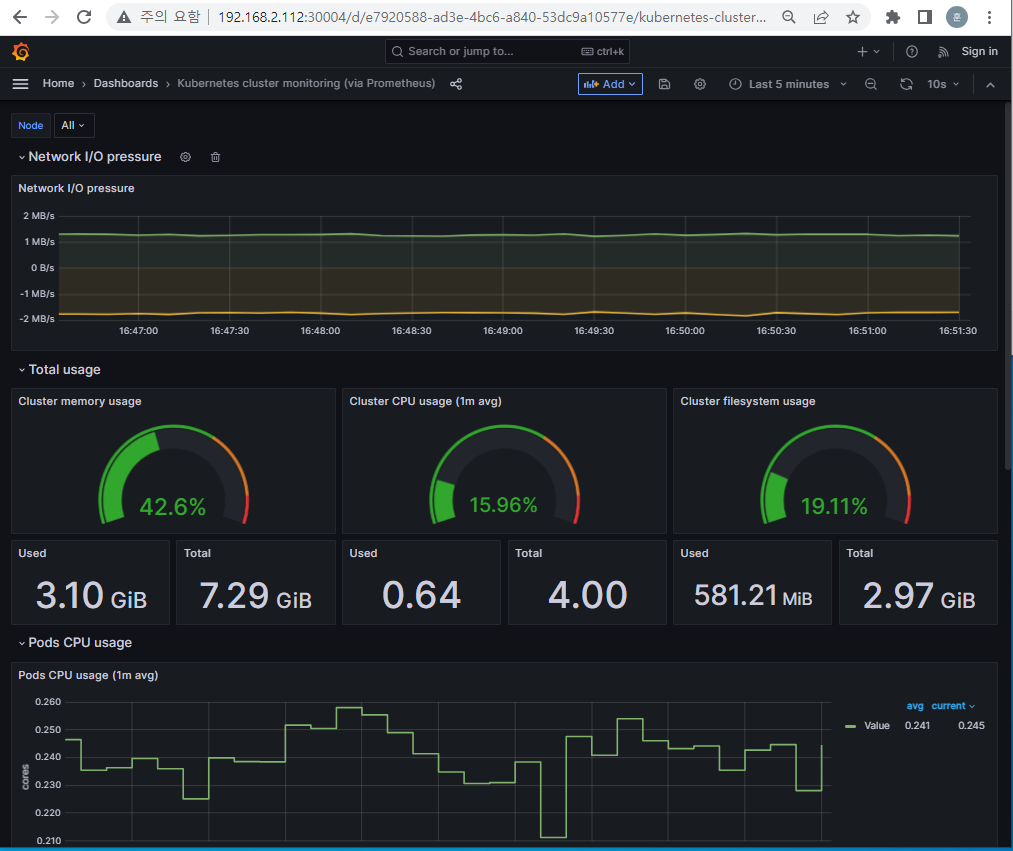
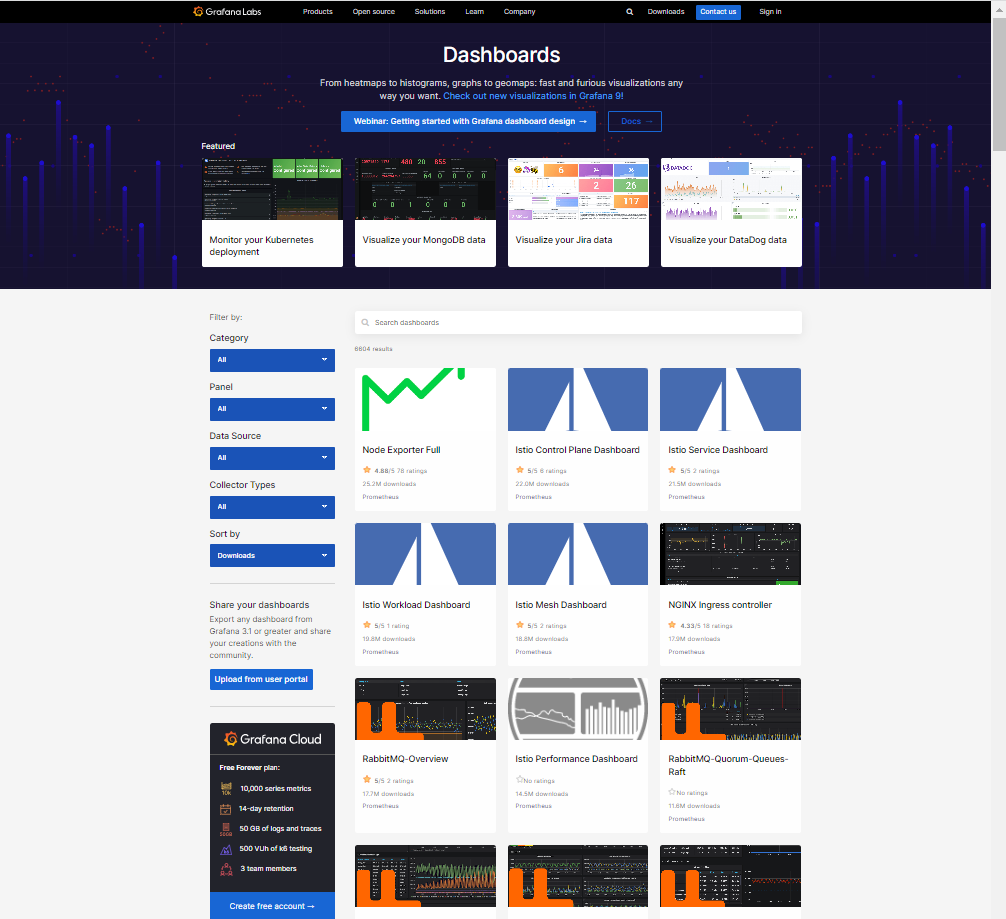
※ https://grafana.com/grafana/dashboards/ # 다양한 데이터 소스에 대한 시각화 대시보드를 선택할 수 있다
8. 부하주고 모니터링
master1 세션에서
# yes > /dev/null &

# top # worker1, worker2와 리소스를 나눠쓰기 있기 때문에 60%에서 왔다갔다한다
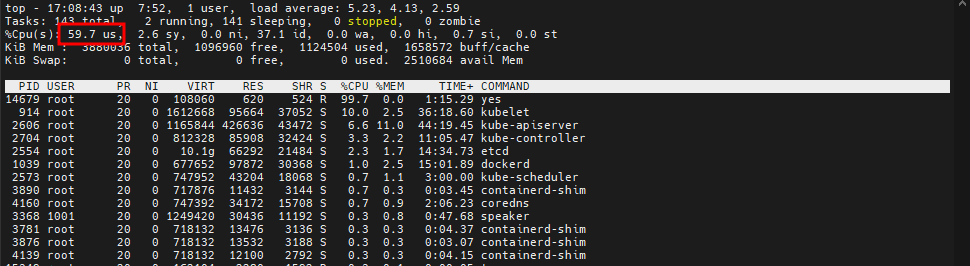
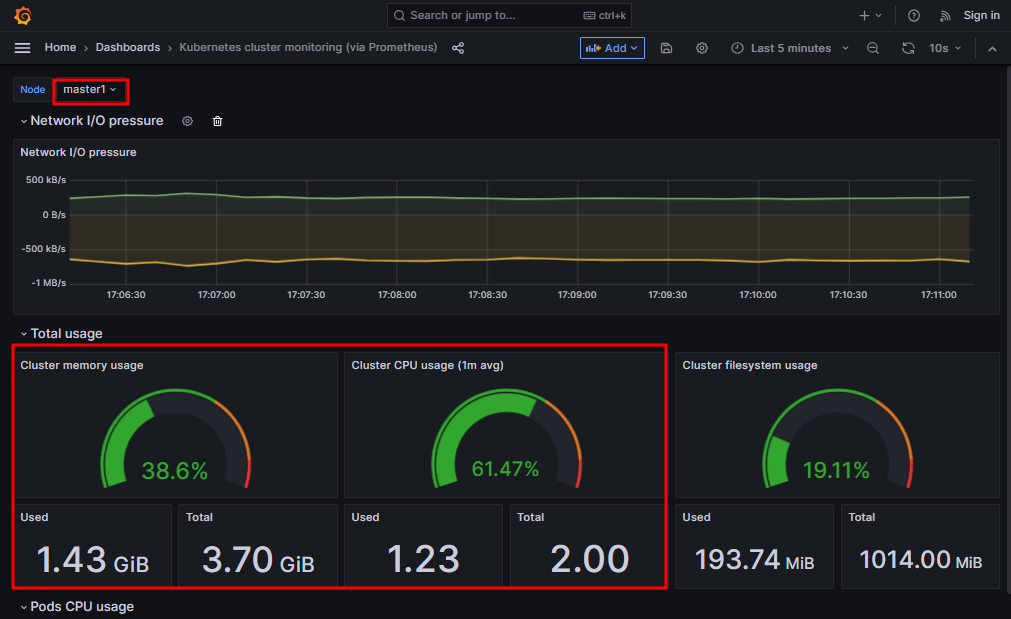
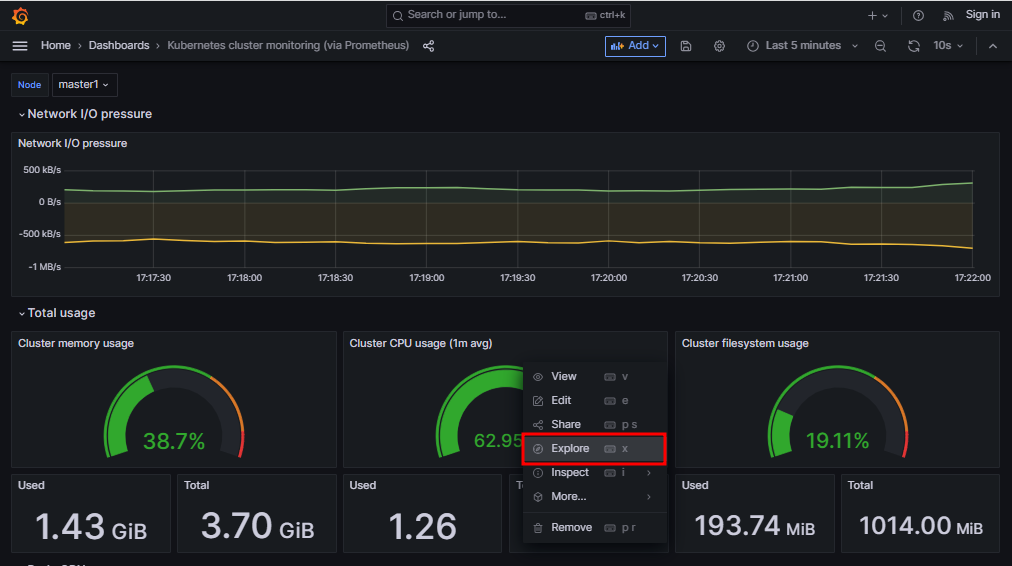
# pkill -9 yes

댓글